Meeting My Smart Meter: A Home Assistant Story
As an Amazon Associate, Smart Home Labo earns from qualifying purchases. This site contains affiliate links.
I didn’t think much about the little gray box outside my apartment. The smart meter just sat there, quietly ticking away, sending numbers to somewhere I rarely check. Every month, an electricity bill appeared in my inbox, and that was the extent of our relationship.
But this October, something changed. Home Assistant 2025.10 introduced the Smart Meter B Route integration, and suddenly that quiet little box became part of my home.
🔌 The First Connection
Section titled “🔌 The First Connection”I ordered a Wi-SUN USB dongle, a Ratoc System one , and, after a short wait, received my B Route credentials from the utility company. Plugging the dongle into my Home Assistant server felt almost ceremonial. I clicked Add Integration → Smart Meter B Route, typed in the credentials, and held my breath, it takes a little while before it connects.
Then, something magical happened.
A new sensor appeared.
Not much at first glance — just a big cumulative number. But that was the first time I’d ever seen my own meter talking directly to me.
📊 Turning Numbers into a Story
Section titled “📊 Turning Numbers into a Story”Using Home Assistant’s utility_meter, I created a monthly counter.
I went into Settings → Devices & Services → Helpers → Create helper → Utility Meter, and set it up like this:
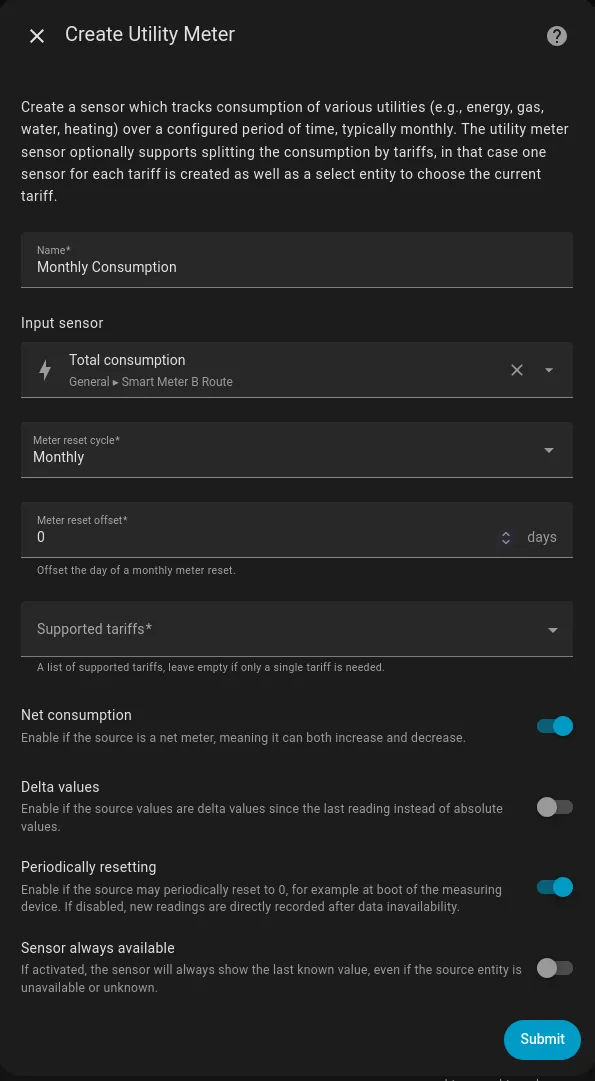
- Enter the
nameyou want like “Monthly consumption” - Select the
input sensor, usually Total consumption from General → Smart Meter B Route - Enter as
meter reset cycle, monthly - Toggle
net consumptionto on - Toggle
periodically resetto on
And then “Submit”.
And then, because I couldn’t resist, I added cost. My plan depends on my electricity usage. Until 120 kWh, I pay 29.9 yen, until 300 kWh, I pay 35.41 yen, and above that, I pay 37.47 yen. So I made a template sensor (I went into Settings → Devices & Services → Helpers → Create helper → Template → Sensor) like this:
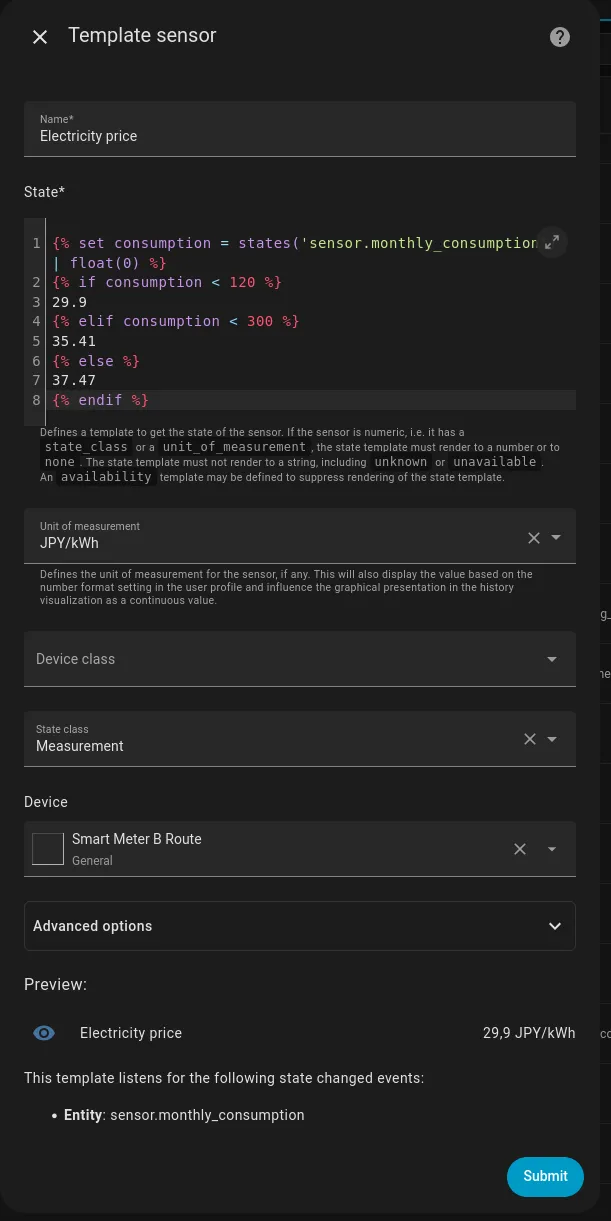
- Enter the
nameyou want like “Monthly cost” - Enter the
stateas follow (adapt the values as needed):
{% set consumption = states('sensor.monthly_consumption') | float(0) %}{% if consumption < 120 %}29.9{% elif consumption < 300 %}35.41{% else %}37.47{% endif %}- As
unit of measurement, enterJPY/kWh - As
state class, selectMeasurement - As
device, selectSmart Meter B Route - You can check the current value in the preview box below
- Then “Submit”
Now my dashboard didn’t just show kilowatt-hours, but a yen amount that felt a lot more real !
⏰ Watching the Hours Pass
Section titled “⏰ Watching the Hours Pass”The first day, I sat with some ice cream and opened my Home Assistant dashboard. A simple chart showed the past 24 hours of consumption. I could see the A/C kicking in when turned on, the TV spike at lunch time, and how little the house used while we slept.
📊 Hourly Electricity Usage (Today)
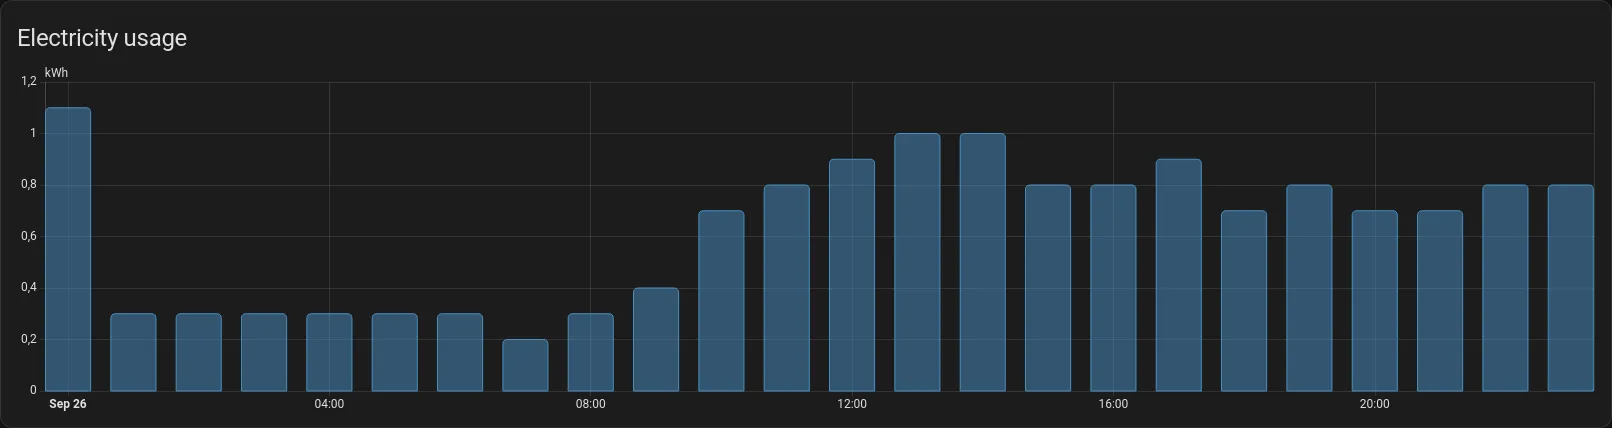
It was like watching the heartbeat of the house.
📊 Hourly Electricity Usage (Today)
🕵️ A Hidden Guest in My Power Bill
Section titled “🕵️ A Hidden Guest in My Power Bill”When I first hooked up smart plugs to my TV, fridge, AC, and other devices, I thought I had the whole picture. But when I opened the energy flow graph, a thick gray bar stared back at me: untracked consumption.
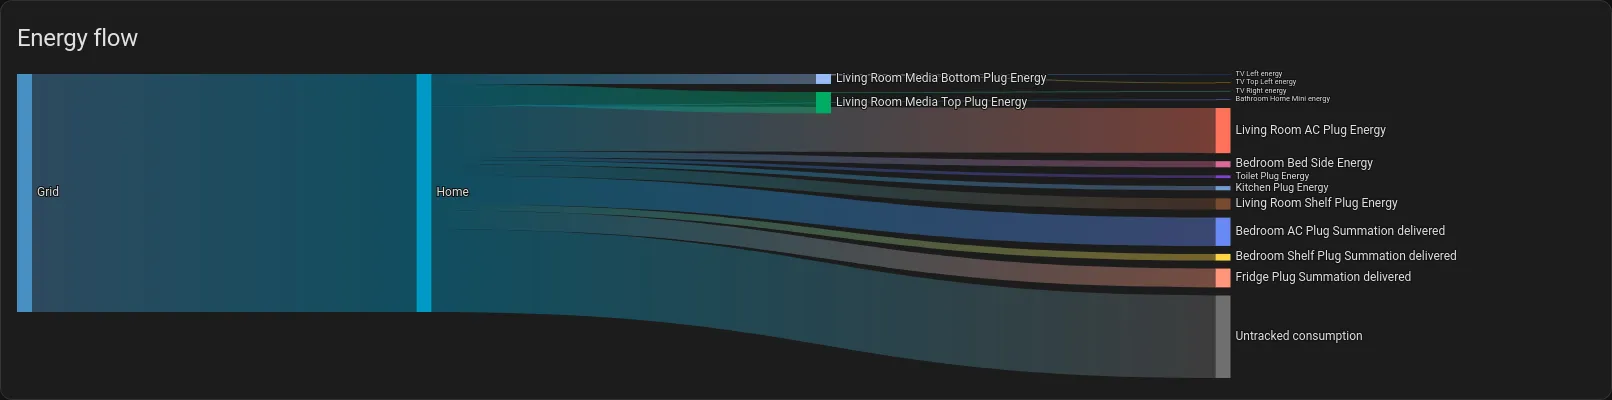
Somewhere in my home, watts are slipping by unnoticed. Maybe it’s the hallway lights, the router, or a cluster of small chargers. Individually tiny, together they add up. And suddenly, the “invisible” part of my electricity bill had a face.
It was humbling — the smart meter wasn’t just confirming what I already knew. It was pointing to what I didn’t know.
🔍 The Next Chapter
Section titled “🔍 The Next Chapter”Now my curiosity is piqued. Do I need more smart plugs? Should I watch how the “untracked” bar changes on weekends versus weekdays? Can I match spikes to hidden habits, like forgetting a heater on overnight?
The point isn’t to eliminate every gray block. It’s to use the meter as a compass. The data lives here, locally in Home Assistant, and it helps me ask better questions about how my home breathes electricity.
For me, this integration isn’t just a tool. It’s an invitation — to keep exploring, keep listening, and maybe discover that the biggest surprises are the ones hiding in plain sight.